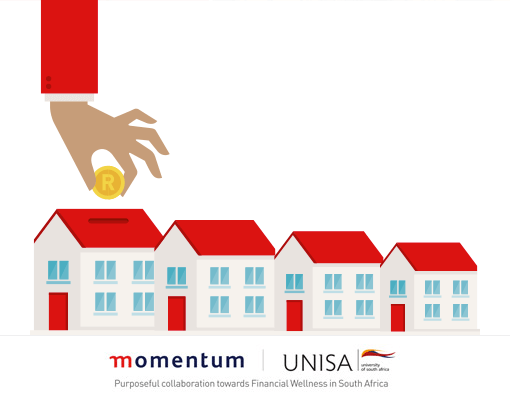
 Financial success is very important for South African households – but 73.5% were financially unwell in 2017, although many could become financially well if they just do the right things.
The data for the seventh round of the Momentum/Unisa Household Financial Wellness research was obtained by means of a nationally representative study of 2 746 households during early 2018. The results show that some households did very well during 2017, others just muddled through, while a large portion struggled immensely.
The results show that the overall household financial wellness score increased from 64.1 points out of 100 in 2011 to 67.7 points in 2017. However, the improvement was marginal between 2016 and 2017 – as the score increased by only 0.4 points. The small improvement can be attributed to a mixed bag of macroeconomic and microeconomic factors. Macroeconomic factors include inter alia, low but improved economic growth rate compared to 2016, low employment growth, high unemployment, low consumer and business confidence, lower growth in gross income per worker, stagnating real GDP per capita growth and low private consumption growth and high levels of poverty and inequality.
Microeconomic aspects include inter alia, low levels of subjective well-being experienced by consumers, low household balance sheet growth, low levels of financial literacy among consumers, strong growth in the number of secondary school finishers (although there are many concerns about the quality of school education) and high levels of financial vulnerability among the low and lower middle income groups.
The overall financial wellness score consists of five forms of capital, namely human, social, physical, asset and environmental capital. Three of the five capitals improved during 2017, while two capitals deteriorated. The lowest capital score of 4.7 (out of 10) was registered by the asset capital index (households’ assets, liabilities and net wealth, reflecting their balance sheet). This decline from 5.0 points in 2016 can be attributed to a number of reasons, namely a decline in the net wealth to disposable income ratio which was caused by a decrease in the assets to disposable income ratio. Such decline can be ascribed to negative growth in house prices (the FNB House Price Index suggests that house prices declined by 1.1% in real terms between 2016 and 2017) and real investments in residential property increasing by less than 1% compared to 2016.
In addition, the real value of financial assets was lower during the first half of 2017 compared to the same time a year before and households’ financial assets were also negatively affected by pension fund and life business surrenders to the value of R160.7 billion during the course of 2017.
The social capital score, which represents households’ ability to take financial control and the role trust and their social support networks play in gathering this competency, increased slightly from 4.9 points in 2016 to 5.1 in 2017. South African households’ social capital score had been one of their Achilles heels for a long time and shows that they just don’t have the means and skills to take control of their finances. This is also evident from the financial literacy results obtained from this survey that show the lack of skills in this domain.
Human capital index scores improved during the period 2011 to 2017 due to a growth in the pool of household members with completed secondary and tertiary qualifications. While more people completed secondary and tertiary qualifications social capital levels remained low due to feelings of disempowerment, low levels of subjective wellbeing, financial vulnerability and low consumer confidence in the economy. Over the period 2014 to 2017 a sizable gap between human and social capital levels were found which is indicative that although the educational system delivers a growing number of matriculants and graduates, the students predominantly acquire academic knowledge and not the high-level cognitive, social and communication skills that is required. The latter “missing” skills requirements prevented matriculants and graduates from obtaining better ‘adaptable’ skills which would have enabled them to live more empowered lives.
It is also important to note that although the human capital index has shown strong growth during the 2012 to 2017 period, the physical capital (income and expenditure) index did not experience the same improvement as one would have expected. In fact, the physical capital index has been fluctuating at nearly the same level over this period, meaning that the improvement in education did not translate in a proportional increase in income.
This disconnect between the human capital and physical capital index scores can to a large extent be explained by low labour demand growth which stems from a skills mismatch in the economy. The skills provided by the South African labour supply are to a large extent out of kilter with the skills demanded by current and prospective employers. This phenomenon also explains a considerable part of the high levels of unemployment, poverty and income inequality – the so-called ‘triple challenge’ – found in South Africa.
One of the most concerning findings of the study is that the proportion of financially well households was virtually unchanged between 2016 and 2017. Only 26.5% of households are considered financially well during 2017, implying that 73.5% of households were financially unwell during this period. More concerning is that the proportion of financially well households was virtually unchanged since 2011. The biggest change was the movement from financially unstable to financially exposed. This means that although a larger proportion of households are still financially unwell, they are not “as financially unwell” than before. Put differently, their degree of financial unwellness softened.
The results of the study showed that households are on different financial wellness journeys due to a large number of variables over which they have and don’t have control. Factors over which households have little control include macroeconomic factors such as low economic growth, high levels of unemployment, political and policy instability and low levels of business confidence. The factors over which households do have control include inter alia, the educational levels of household members, their financial literacy and capability levels, their work statuses, the degree to which they conduct debt and financial risk management and financial planning, the amount of money they earn and the level to which they save and accumulate their net wealth.
The results of the study have shown that although households do have control of these factors they generally don’t budget, conduct very little debt-and financial planning and generally have very low financial literacy and capability levels.
The results of the study also show that when financially well households are compared to financially unwell households, the financially well households have a big head start as they possess higher human capital scores, as well as much higher social capital scores. They also engage more actively in financial activities, which contributed to their output scores being higher than their input scores, making them financially well.
Tertiary qualifications stand out as a strong predictor of household financial wellness outcomes (i.e. a larger percentage of households in the financially well category have tertiary qualifications, namely 39.2% vs 11.2%). The financial literacy levels of the financially well are also higher than that of the financially unwell, but in both cases the level of financial literacy is concerningly low. However, the financially well are more likely to overcome this deficit as they (on a larger scale) make use of professional financial advice. The proportion of households who do make use of professional financial advice is, however, disproportionately low.
The results from the statistical modelling performed for the purpose of the study show that a comprehensive intervention is needed for financially unwell households to become financially well.
Such a comprehensive intervention should be more multi-faceted than merely providing social grants, social housing, free services and financial products. The said grants, housing and services may prevent financially unwell households from becoming even more financially unwell. But putting households on a path of financial wellness growth will necessitate high quality education, enhancement of their financial literacy and financial capabilities, improving their understanding of the need and role of financial advisers, -planning and -products for their quality of life, making such planning and products accessible and affordable while also customising it to their needs and programmes to improve their social empowerment (to take control of their own lives and financial situations).
An innovative approach to understanding the financially well and financially unwell groups used in this study was to determine the human needs structures of these two broader wellness groups. This was done by using Maslow’s hierarchy of needs which postulates that humans have five needs levels, namely physiological, safety, social (love and belonging), esteem and self-actualization needs. Although prior research might differ on the number of levels in the hierarchy of financial needs, the consensus view is that short-term basic financial needs are considered lower level savings goals; financial security needs are middle level; and self-actualisation are at the top of the human needs pyramid. Parallel to the increase in financial needs is also the rise in sophistication of the products utilised to fulfil those financial needs. For example, lower level financial needs could be satisfied by the utilisation of a transaction or savings accounts, but shares or exchange traded funds can be utilised to provide growth at the higher end of the needs hierarchy.
The results of this study also show that financially well households spend proportionately less on physiological needs such as groceries and clothing (than financially unwell households). They therefore can fulfil other needs such as insurance and medical cover and saving more money. Financially well households succeed in ensuring that their safety needs are sufficiently addressed by obtaining short-term insurance, life and disability insurance and incurring affordable debt. Financially well households are also good at addressing their social needs via financial behaviour aimed at ensuring that they are financially well, i.e. they formulate financial plans, set the correct financial goals, update the plans and goals regularly and monitor the financial outcomes coming from such plans.
Based on the findings of this research project, as well as discussions based on the findings of this project, ten behaviour checks were identified by the Unisa research team that could assist households on their financial wellness journeys, namely (1) actionable high quality market-related skills, (2) continuous growth in personal (i.e. cognitive, communication and social) skills, (3) personal empowerment and self-efficacy, (4) financial literacy, (5) financial capability, (6) full financial inclusion, (7) financial planning by making use of qualified financial advisers, (8) assisted and informed portfolio composition including financial coaching, (9) long-term consumption smoothing, increased savings and preparation for retirement and (10) continuous monitoring and evaluation of financial outcomes.
It is clear from this list that in order to ensure broad-based poverty reduction, household financial wellness growth and thereby the reduction of stark household financial inequalities, there needs to be a national mind shift away from protectionist, redistributive and interventionist social policies towards policies geared at ensuring skills growth, personal empowerment, financial literacy and capability creation, the use of financial advisers and coaches/mentors and the direct monitoring of financial capability and wealth outcomes.
- MRF Unveils Latest MAPS® Data - 20th February 2025
- The BRC announces changes to the board and updates for 2025 - 17th December 2024
- Top 50 DSTV TV programmes – October 2024 - 12th November 2024


