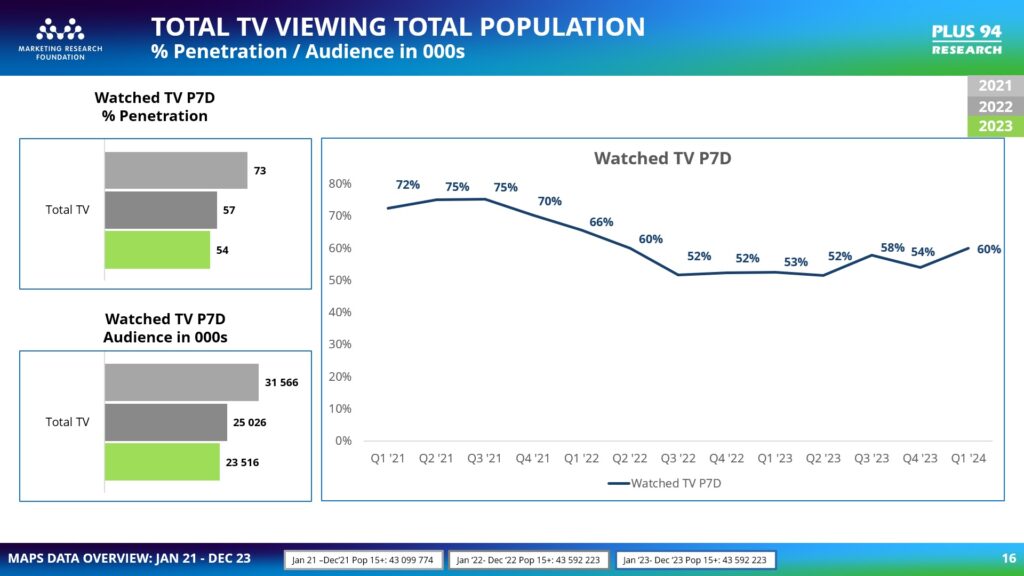
The latest data from the Marketing Research Foundation’s Marketing All Product Survey (MAPS™) first quarter figures of 2024 reveals a slight recovery in Television viewership as the lights stay on.
Johann Koster, CEO of the Marketing Research Foundation (MRF), shares his insights on this trend, “We’re encouraged by TV viewership in South Africa as the numbers from the MAPS™ survey indicate an upward move for the first quarter of 2024 after Loadshedding was called off at the beginning of the year.”
The Numbers Don’t Lie
The MAPS™ quarterly data paints an interesting picture of TV’s performance over the past few years. While the numbers are still down from an average of 73% in 2021 to 54% in 2023 the quarterly views show an increase of 6% from Q4 2023 (54%) to Q1 2024 (60%). “Our upcoming MAPS™ release (fieldwork period of July 2023 to June 2024) will show whether TV is able to maintain the gains following the pause in load shedding,” comments Koster.

While Loadshedding caused havoc, not only in the consumer space but the media industry too, the digital migration process has also impacted TV viewership. Numerous households were cut off when the analogue signals were switched off in a number of provinces. Without the necessary equipment to receive the replacement digital signals, many households were left without the means of receiving TV transmissions.
The major provinces are yet to be switched off – towards the end of this year – possibly impacting TV numbers again. Although households that report they have adopted the DDT boxes have shown a steady increase, there is a clear lag in adoption and TV is potentially facing another watershed moment.
The Rise of Streaming
MAPS™ data also sheds light on the streaming landscape and rise in streaming across all platforms from 2021:
- Netflix leads the pack with a 12-month average in 2023 of 14.6% of the population having access, followed by Showmax at 8.3% in 2023.
- Netflix up by 4%. 10.6% in 2021 to 14.6% in 2023.
- Showmax up by 3.9%. 4.4% in 2021 to 8.3% in 2023.
- However, taking a quarter-on-quarter view Netflix shows a slight dip in Q1 of 2024 while Showmax had a slight increase, suggesting that Showmax may be making some inroads.
- Amazon Prime, Apple TV and Disney+ have all shown small but steady increases over the three years, albeit from a much smaller base.
“An interesting point in the streaming numbers is that only about half of the people, that access Netflix and Showmax, do so with their own login indicating that the sharing of login details is clearly prevalent,” Koster observes.
Quarterly Insights
One of the most exciting aspects of the MAPS™ data is its quarterly release schedule. Koster explains the significance: “Annual data is valuable, but in today’s fast-paced media landscape, it’s not enough. Our quarterly updates give marketers and advertisers a better understanding on viewer behaviour, allowing them to adapt strategies.”
The Power of TV Advertising
TV remains a potent platform for advertisers and still packs a punch. It’s not just about reach! TV creates emotional connections and builds brand trust in ways that digital platforms and other traditional media often struggle to match. Koster adds, “However, there is a close relationship with social media. MAPS™ suggests that close to 40% of TV viewers report that they are on social media while watching TV which could indicate a clear opportunity for cross platform engagement with audiences.”
It is this type of insight into the data that helps advertisers strategically define the macro strategies of media planning.
Join the MRF for More Insights
Is the rise of TV viewership more than just a fleeting trend? Curious about how TV habits have changed since loadshedding eased? Join the MRF’s webinar for the next data release and see if the upward trend continues into the next quarter of 2024.
The MRF is hosting a webinar to dive deeper into the latest MAPS™ data and its implications for the media and advertising industry. Koster extends an invitation “The next major MAPS release will be released soon and will include the fieldwork period of July 2023 to June 2024. Together with research partners, Plus94, we will be inviting the industry to participate in a webinar to discuss the latest MAPS data.
Watch our social media and check emails for the invitation.”
Don’t miss this opportunity to gain strategic insights to media planning and advertising. The data presented could be the key to unlocking new levels of campaign effectiveness and ROI.
As the lines between traditional and digital media continue to blur, staying informed with up-to-date, comprehensive data has never been more crucial. The MRF’s MAPS™ offers just that, providing a quarterly pulse on the nation’s media consumption habits.
For additional information on MAPS – http://mrfsa.org.za/maps/
Social Media: Facebook – https://www.facebook.com/MRFSouthAfrica/
LinkedIn – https://www.linkedin.com/company/mrfsa
- MRF Unveils Latest MAPS® Data - 20th February 2025
- The BRC announces changes to the board and updates for 2025 - 17th December 2024
- Top 50 DSTV TV programmes – October 2024 - 12th November 2024

